
If a probability problem has more than 1 stage, a probability tree diagram is often the cleanest way to see what can happen. Instead of trying to hold every outcome in your head, you draw branches, label each probability, and calculate each complete path.
This guide shows how to draw a probability tree diagram step by step, including examples for independent events, dependent events, and conditional probability. If you want to make one faster after learning the method, try the probability tree generator on the ProbPath homepage.
Key Takeaways
- A probability tree diagram starts with 1 root and branches into every possible outcome at each stage.
- Probabilities from the same node should add to 1, or 100%.
- To find the probability of a complete path, multiply along the branches.
- To find the probability of "one of several paths," add the completed path probabilities.
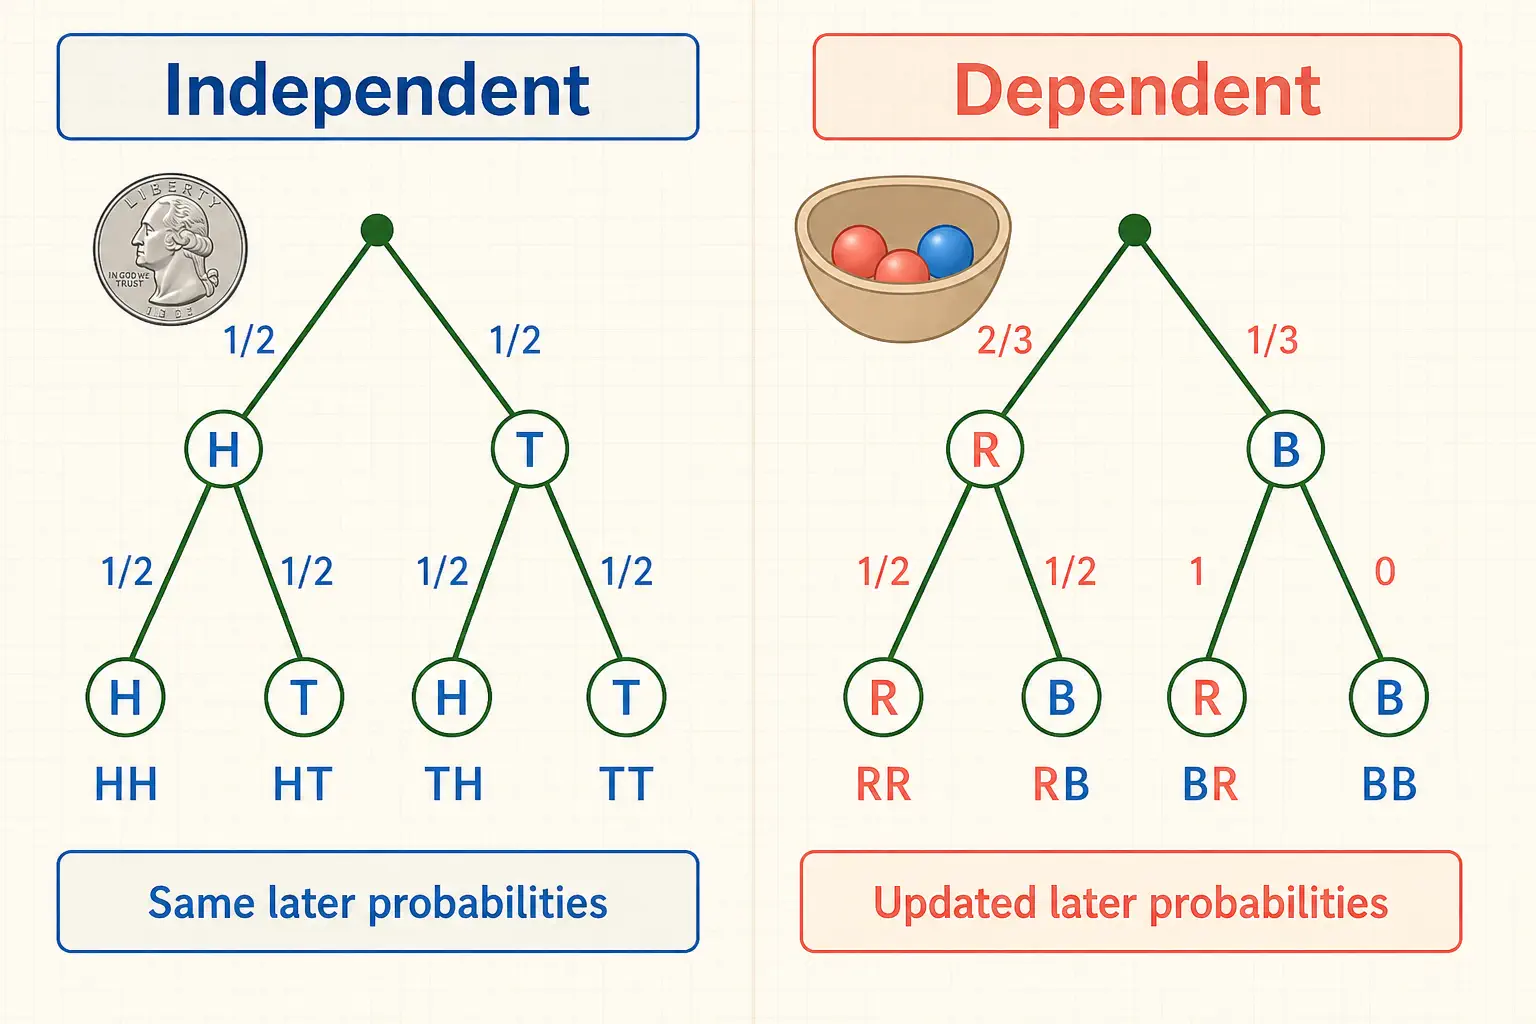
- Independent events keep the same probabilities at each stage; dependent events change after earlier outcomes.
Table of Contents
- What is a probability tree diagram?
- When should you use one?
- How to draw a probability tree diagram
- Example 1: independent events
- Example 2: dependent events
- Example 3: medical test
- Independent vs. dependent probability trees
- Fractions, decimals, and percentages
- How to check your work
- Common mistakes
- Probability tree diagram worksheet
- Frequently asked questions
- Sources
What Is a Probability Tree Diagram?
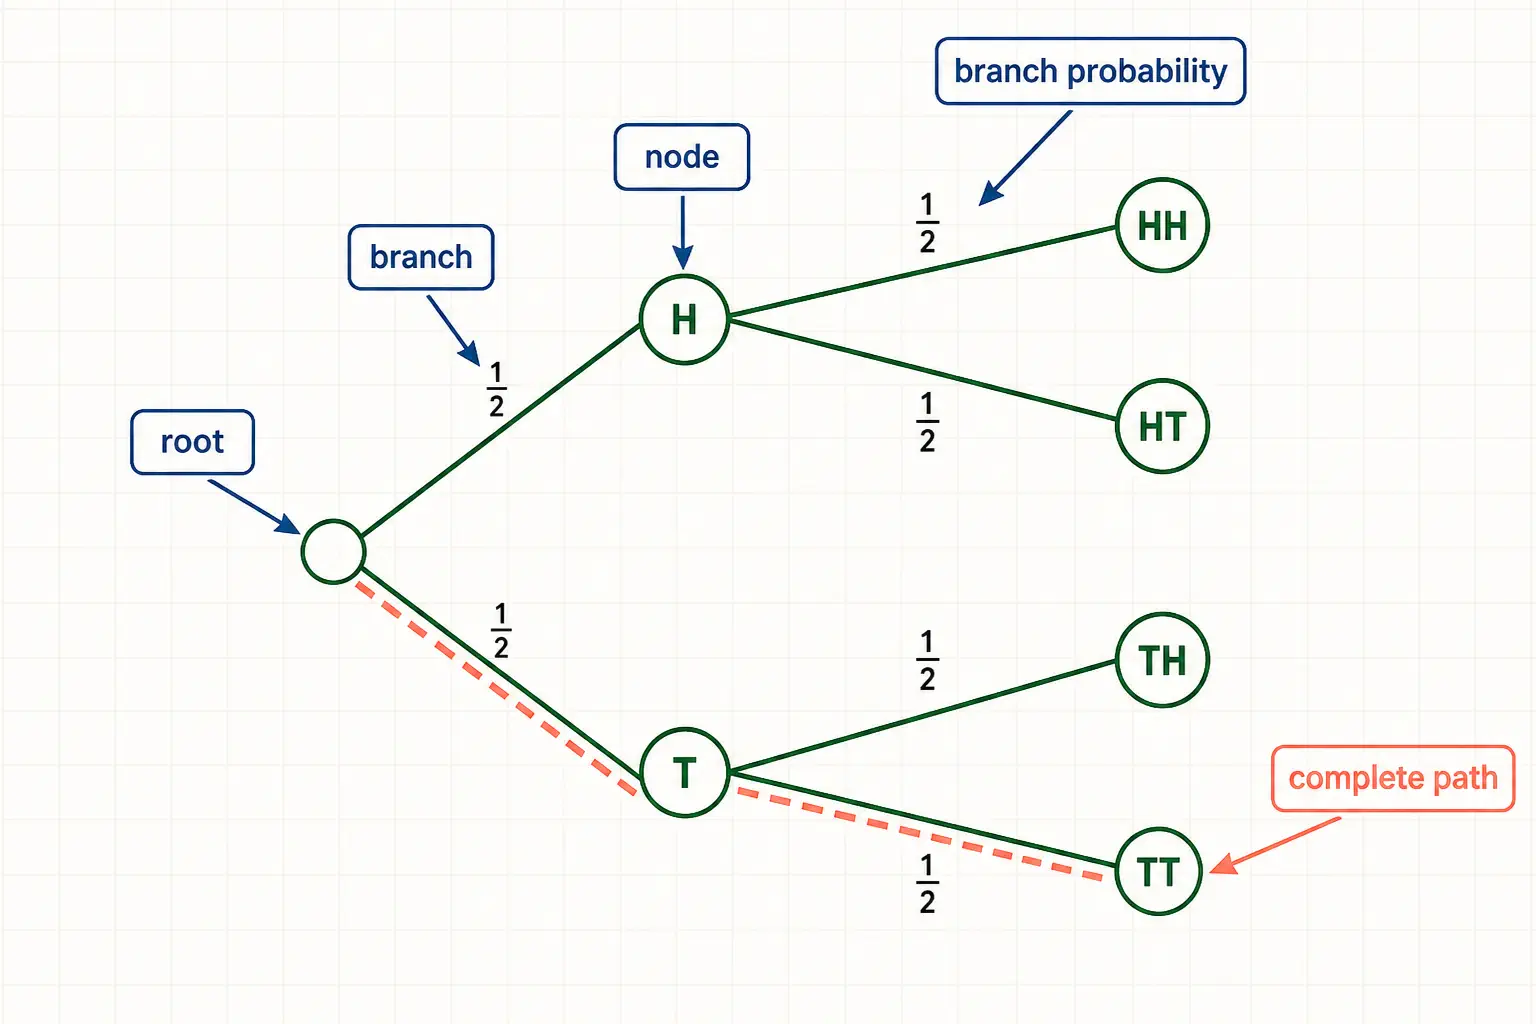
A probability tree diagram is a branching diagram that shows the possible outcomes of a multi-stage chance experiment. Each branch represents an outcome, each branch label shows its probability, and each complete path from start to finish represents one combined outcome.
For example, flipping a coin twice has 2 stages. The first stage has 2 outcomes: heads or tails. The second stage also has 2 outcomes after each first flip. That gives 4 complete paths: heads-heads, heads-tails, tails-heads, and tails-tails.
The core rules are simple:
| Task | Rule |
|---|---|
| Find one exact sequence | Multiply along one complete path |
| Find any of several sequences | Add the matching complete path probabilities |
| Check each split | Probabilities from the same node add to 1 |
| Check the whole tree | Final path probabilities add to 1 |
Math Is Fun explains the same practical rule as multiplying along branches and adding down columns for combined outcomes. Utah State University also describes a complete path probability as the product of the branch probabilities along that path.
When Should You Use One?
Use a probability tree diagram when a probability problem has 2 or more stages and the order of events matters. Trees are especially useful when the second event depends on the first.
Good use cases include:
- Flipping 2 or 3 coins.
- Rolling a die and then spinning a spinner.
- Drawing 2 cards or marbles without replacement.
- Modeling test results with true positives and false positives.
- Solving conditional probability questions.
A tree is usually unnecessary for a single-stage event, such as "What is the probability of rolling a 6 on one fair die?" It becomes useful when you need to track paths. If a problem can be solved with one multiplication, drawing the full tree can be slower than needed.
How to Draw a Probability Tree Diagram
Step 1: Define the Experiment
Write down the full chance process in plain language.
Example:
"A bag contains 3 red marbles and 2 blue marbles. One marble is drawn, not replaced, and then a second marble is drawn."
This sentence tells you 4 important details:
- There are 2 stages.
- Each stage is a marble draw.
- The possible outcomes are red and blue.
- The second draw is dependent because the first marble is not replaced.
Step 2: List the Outcomes for the First Stage
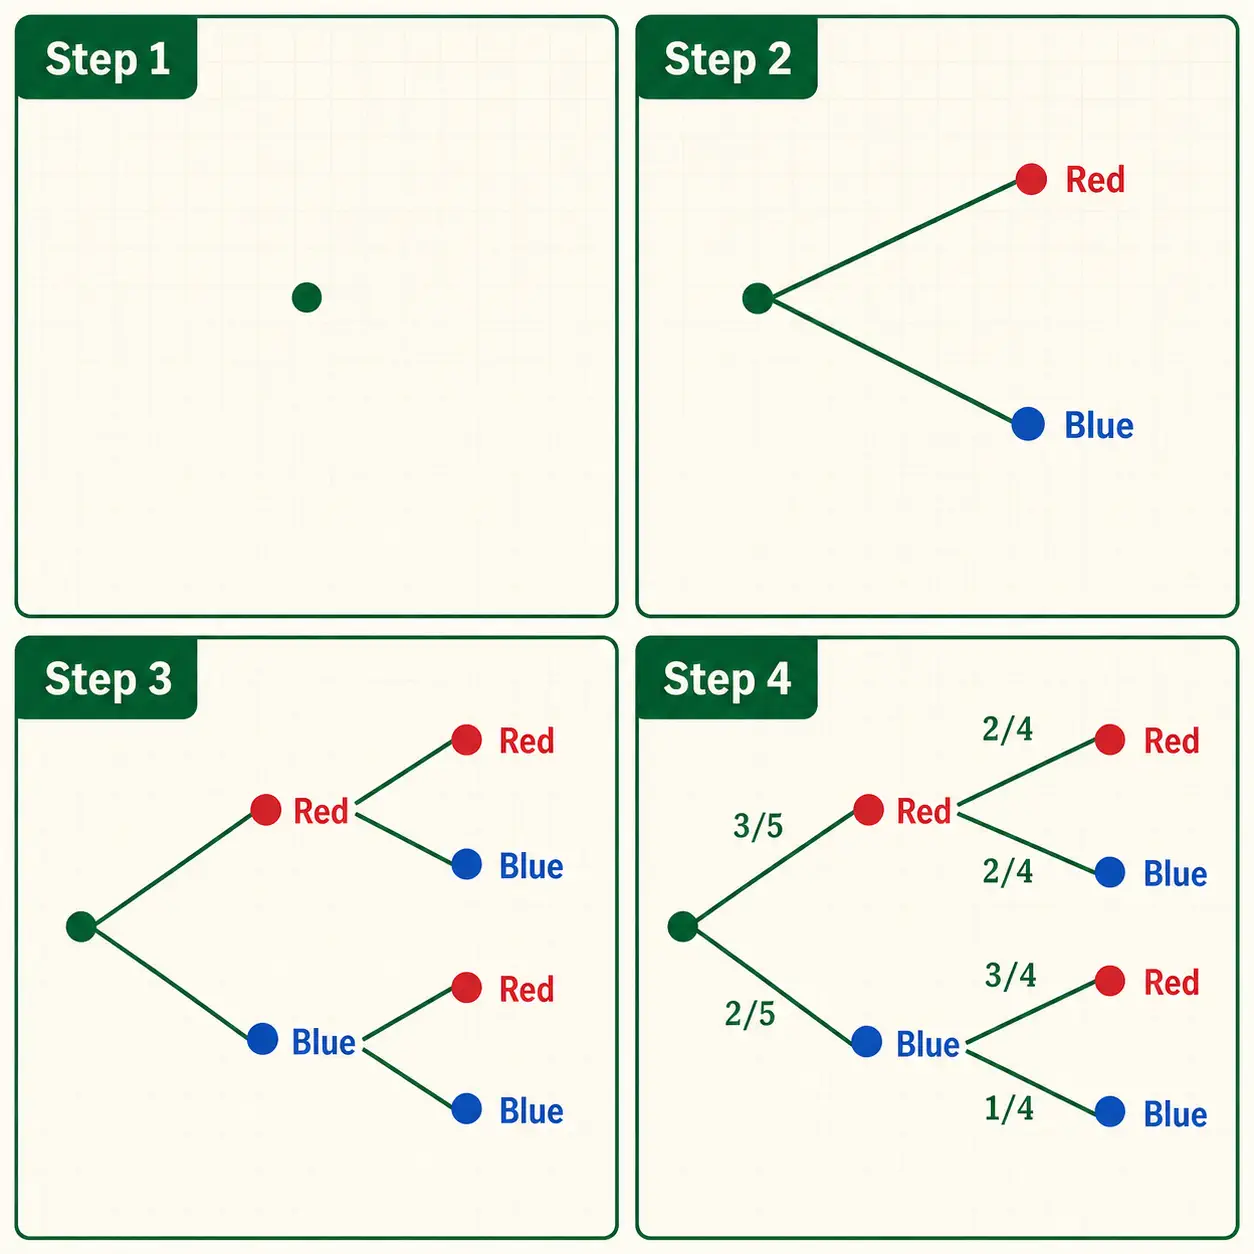
Start with 1 root point. Draw one branch for every possible outcome in stage 1.
For the marble example:
- Red
- Blue
Since there are 3 red marbles and 2 blue marbles, there are 5 marbles total:
| First draw | Probability |
|---|---|
| Red | 3/5 |
| Blue | 2/5 |
These probabilities add to 5/5, so the first split is complete.
Step 3: Add the Next Stage from Each Outcome
From each first-stage outcome, draw the second-stage branches.
If the first draw is red, the bag now has 2 red marbles and 2 blue marbles left. That means the second-stage probabilities are:
| Path so far | Second draw | Probability |
|---|---|---|
| Red first | Red second | 2/4 |
| Red first | Blue second | 2/4 |
If the first draw is blue, the bag now has 3 red marbles and 1 blue marble left:
| Path so far | Second draw | Probability |
|---|---|---|
| Blue first | Red second | 3/4 |
| Blue first | Blue second | 1/4 |
Notice that the second-stage probabilities are different depending on the first branch. That is the signature of a dependent event.
Step 4: Label Every Branch Clearly
Each branch should have both:
- The outcome label, such as Red or Blue.
- The probability label, such as 3/5 or 2/5.
Do not put only the outcome at the end of the branch. The probability belongs on the branch because it describes the chance of moving along that branch from the current node.
Step 5: Multiply Along Each Complete Path
A complete path runs from the root to the final outcome.
For the marble example:
| Complete path | Calculation | Final probability |
|---|---|---|
| Red, Red | 3/5 x 2/4 | 6/20 = 3/10 |
| Red, Blue | 3/5 x 2/4 | 6/20 = 3/10 |
| Blue, Red | 2/5 x 3/4 | 6/20 = 3/10 |
| Blue, Blue | 2/5 x 1/4 | 2/20 = 1/10 |
The final probabilities are 3/10, 3/10, 3/10, and 1/10.
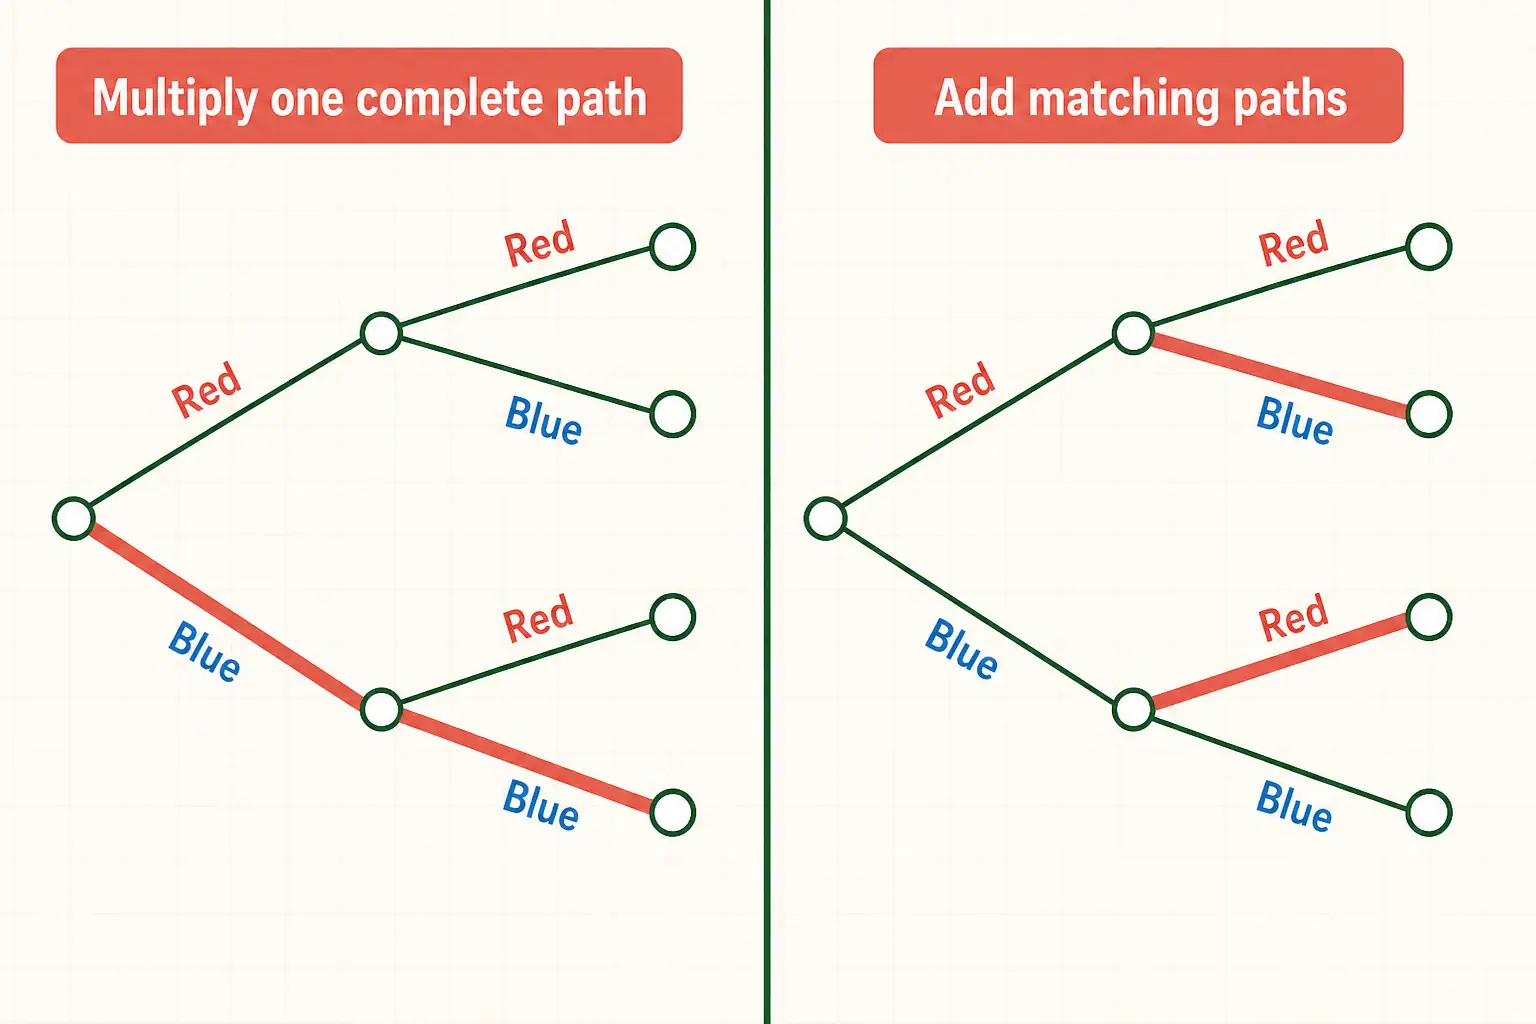
Step 6: Add Matching Paths When the Question Says "Or"
If the question asks for one exact outcome, use one path.
Example:
"What is the probability of drawing 2 blue marbles?"
Use the Blue, Blue path:
2/5 x 1/4 = 2/20 = 1/10
If the question asks for a broader result, add every path that matches.
Example:
"What is the probability of drawing 1 red and 1 blue marble in any order?"
The matching paths are Red, Blue and Blue, Red:
3/10 + 3/10 = 6/10 = 3/5
The phrase "in any order" is a clue that more than 1 path may count.
Example 1: Independent Events
Suppose you flip a fair coin twice. Each flip has 2 outcomes:
- Heads = 1/2
- Tails = 1/2
Because the first flip does not affect the second flip, the probabilities stay the same on every second-stage branch.
| Path | Calculation | Probability |
|---|---|---|
| Heads, Heads | 1/2 x 1/2 | 1/4 |
| Heads, Tails | 1/2 x 1/2 | 1/4 |
| Tails, Heads | 1/2 x 1/2 | 1/4 |
| Tails, Tails | 1/2 x 1/2 | 1/4 |
Question: What is the probability of getting at least 1 head?
The matching paths are Heads-Heads, Heads-Tails, and Tails-Heads:
1/4 + 1/4 + 1/4 = 3/4
So the probability is 3/4, or 75%.
For 3 flips, the same idea applies but each complete path now has 3 probabilities multiplied together. The tree grows wider, but the rule stays the same: multiply along the path and add matching paths.
Stats4STEM summarizes the multiplication rule for independent events as P(A and B) = P(A)P(B), which is exactly what the tree is doing along each complete path.
Try it in ProbPath:
Flip a fair coin twice. Draw a probability tree and find the probability of getting at least one head.Example 2: Dependent Events
Now suppose a bag has 4 green counters and 1 yellow counter. You draw 2 counters without replacement.
The first draw probabilities are:
| First draw | Probability |
|---|---|
| Green | 4/5 |
| Yellow | 1/5 |
If the first counter is green, the bag has 3 green counters and 1 yellow counter left:
- Green second = 3/4
- Yellow second = 1/4
If the first counter is yellow, the bag has 4 green counters and 0 yellow counters left:
- Green second = 4/4
- Yellow second = 0/4
The complete paths are:
| Path | Calculation | Probability |
|---|---|---|
| Green, Green | 4/5 x 3/4 | 12/20 = 3/5 |
| Green, Yellow | 4/5 x 1/4 | 4/20 = 1/5 |
| Yellow, Green | 1/5 x 4/4 | 4/20 = 1/5 |
| Yellow, Yellow | 1/5 x 0/4 | 0 |
Question: What is the probability of drawing exactly 1 yellow counter?
The matching paths are Green, Yellow and Yellow, Green:
1/5 + 1/5 = 2/5
So the probability is 2/5, or 40%.
Try it in ProbPath:
A bag has 4 green counters and 1 yellow counter. Draw 2 counters without replacement. Show the probability tree and find the probability of drawing exactly 1 yellow counter.Example 3: Medical Test
Probability trees are useful outside the classroom. Medical testing is a common real-world case because a test result can be positive or negative, and the person can be sick or healthy.
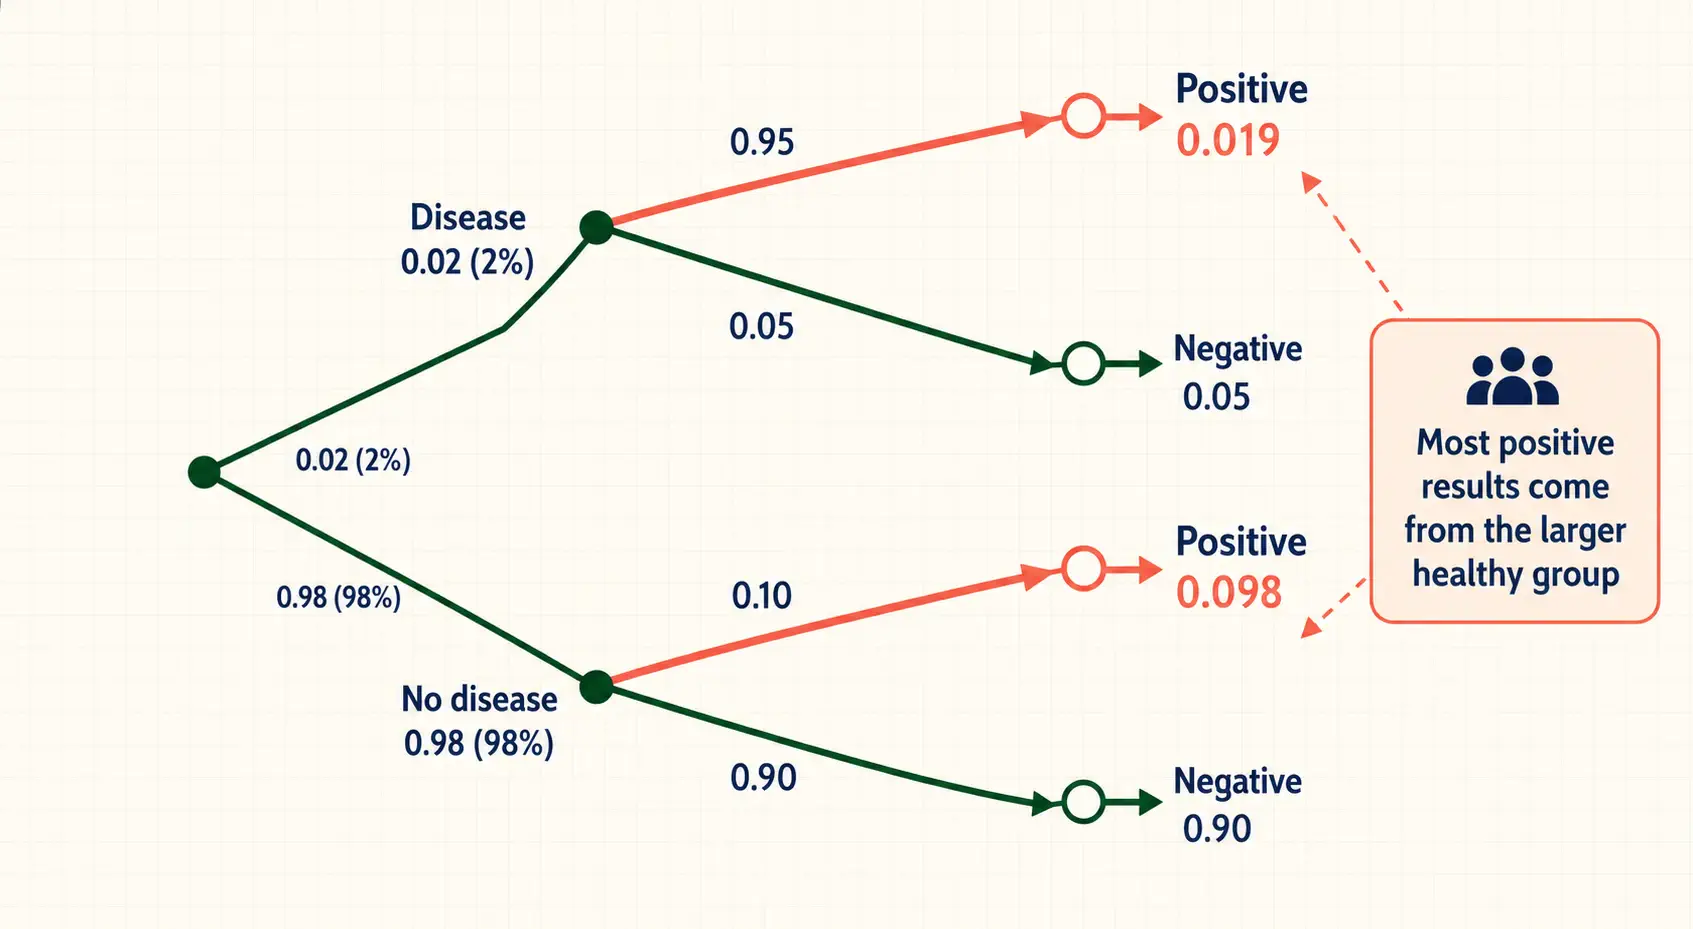
Suppose a disease affects 2% of the population. A test has:
- 95% true positive rate: if a person has the disease, the test is positive 95% of the time.
- 90% true negative rate: if a person does not have the disease, the test is negative 90% of the time. That means the false positive rate is 10%.
The first split is disease status:
| Disease status | Probability |
|---|---|
| Has disease | 0.02 |
| No disease | 0.98 |
From each branch, add the test result:
- Has disease → Positive: 0.95; Negative: 0.05
- No disease → Positive: 0.10; Negative: 0.90
The complete paths are:
| Path | Calculation | Probability |
|---|---|---|
| Disease, Positive | 0.02 x 0.95 | 0.019 |
| Disease, Negative | 0.02 x 0.05 | 0.001 |
| No disease, Positive | 0.98 x 0.10 | 0.098 |
| No disease, Negative | 0.98 x 0.90 | 0.882 |
Question: If a person tests positive, what is the probability they actually have the disease?
This is a conditional probability question. Only the paths that end in "Positive" matter:
0.019 / (0.019 + 0.098) = 0.019 / 0.117 ≈ 0.162
So even after a positive test, the probability of having the disease is only about 16.2%. This surprising result happens because the disease is rare and false positives are common in the healthy majority.
Try it in ProbPath:
A disease affects 2% of a population. A test is 95% accurate for true positives and has a 10% false positive rate. Draw a probability tree and find the probability that a person who tests positive actually has the disease.Independent vs. Dependent Probability Trees
The main difference is whether earlier events change later probabilities.
| Feature | Independent events | Dependent events |
|---|---|---|
| Does the first event affect the second? | No | Yes |
| Do later branch probabilities change? | Usually no | Usually yes |
| Common example | Flipping a coin twice | Drawing without replacement |
| Key question to ask | "Does anything get used up or changed?" | "What changed after the first outcome?" |
For independent events, you can often repeat the same branch probabilities at every stage. For dependent events, recalculate the probabilities from each node.
Fractions, Decimals, and Percentages
Probability tree diagrams can use fractions, decimals, or percentages. The method does not change; only the labels change.
| Format | Example node sum | When to use it |
|---|---|---|
| Fractions | 1/4 + 3/4 = 1 | School problems and exact calculations |
| Decimals | 0.25 + 0.75 = 1 | Real-world data, such as medical tests |
| Percentages | 25% + 75% = 100% | Reports and presentations |
No matter which format you choose, the branches from the same node must still add to the total: 1, 1.0, or 100%. Do not mix formats on the same tree. If one branch is 0.3, the complementary branch should be 0.7, not 70%.
How to Check Your Work
Before you trust your answer, run these 4 checks:
- Each node adds to 1. If a node has branches 1/3, 1/3, and 1/3, the split is complete. If it adds to 2/3, something is missing.
- Every stage has the right number of branches. A 2-stage experiment should not accidentally stop after stage 1.
- Every complete path has a final probability. Multiply all the branch probabilities along the path.
- Final path probabilities add to 1. If they do not, check for a missing branch, a copied probability, or a dependent-event mistake.
For percentage trees, use 100% instead of 1. For decimal trees, use 1.0.
If a final answer looks wrong, the most common cause is a denominator that did not update after a dependent event.
Common Mistakes
Mistake 1: Adding Along a Path
Do not add probabilities along a single complete path. If the path is Red then Blue, multiply:
3/5 x 2/4 = 3/10
Adding 3/5 + 2/4 would not represent the probability of both events happening.
Mistake 2: Forgetting to Recalculate Dependent Events
In "without replacement" problems, the second-stage denominator usually changes. If 1 item is removed from 5, the next denominator is 4, not 5.
Mistake 3: Adding Branches That Are Not Final Paths
Only add completed path probabilities. If a question asks for "at least 1 head," add the final paths that end in a matching outcome, not the branch labels from the middle of the tree.
Mistake 4: Leaving Out Complements
If a node has 2 outcomes and one probability is 0.7, the other should be 0.3. A missing complement is one of the fastest ways to break the tree.
Mistake 5: Drawing Branches for Non-Mutually-Exclusive Outcomes
Every set of branches from one node must cover all possible outcomes, and no two branches can overlap. For example, if you split a card draw into "red" and "king," the branches overlap because the king of hearts is both red and a king. The correct split would be by suit or by a single property such as color.
Mistake 6: Mixing Formats on the Same Tree
If one branch is labeled 1/2, do not label another branch on the same tree as 0.5 or 50%. Pick one format and use it everywhere. Mixing formats makes it easy to miscalculate when you multiply or add probabilities.
Probability Tree Diagram Worksheet
Use this quick worksheet whenever you draw a tree:
| Prompt | Your answer |
|---|---|
| What is the experiment? | |
| How many stages are there? | |
| What are the outcomes at stage 1? | |
| Are later events independent or dependent? | |
| What probabilities go on each branch? | |
| Which complete paths match the question? | |
| Did each node add to 1? | |
| Did the final path probabilities add to 1? |
Go through each row in order. Filling in the first 4 rows before drawing any branches prevents most common mistakes. The last 2 rows are your final safety check.
Frequently Asked Questions
What is the easiest way to draw a probability tree diagram?
Start with the first event, draw one branch for each possible outcome, and label each branch with its probability. Then repeat the same process from the end of every branch for the next event. Multiply along complete paths and add paths that match the question.
Do you add or multiply in a probability tree diagram?
You multiply along a complete path because the path means one event happens and then another event happens. You add completed path probabilities when the answer can happen in more than one mutually exclusive way, such as Red-Blue or Blue-Red.
How do you know if a probability tree is independent or dependent?
A probability tree is independent when the outcome of one event does not change the probabilities of later events. It is dependent when an earlier outcome changes what remains or changes the condition for the next probability.
What should every split in a probability tree add up to?
Every set of branches from the same node should add to 1, or 100%. If a node does not add to 1, the tree is missing an outcome, has an impossible probability, or has a calculation error.
Can a probability tree diagram have more than 2 branches?
Yes. A probability tree can have any number of branches from a node, as long as the branches represent all possible outcomes at that stage and their probabilities add to 1. A die roll, for example, can have 6 branches.
Can a probability tree have more than 2 stages?
Yes. A probability tree can have as many stages as the problem needs. For example, flipping a fair coin 3 times creates 3 stages and 8 complete paths. The same rules apply: multiply along each path and add matching paths.
Do the probabilities in a tree diagram have to be fractions?
No. You can use fractions, decimals, or percentages. Choose one format for the whole tree and stay consistent. The important rule is that the branches from each node add to the correct total: 1, 1.0, or 100%.
What is the difference between a tree diagram and a Venn diagram?
A probability tree shows sequences of events over time, with each branch representing a possible outcome at each stage. A Venn diagram shows overlaps between sets or events at a single point in time. Use a tree when order and stages matter; use a Venn diagram when you only need to show relationships between groups.
Sources
- Math Is Fun: Probability Tree Diagrams, accessed August 25, 2026.
- Utah State University: Probability Tree Diagrams, accessed August 25, 2026.
- Stats4STEM: Multiplication Rule and Tree Diagrams, accessed August 25, 2026.